USMD vs DO in Internal Medicine: Same Match Rate, Different Programs
The conventional “DO penalty” framing in Internal Medicine is wrong. DOs match IM at 95.2% versus 97.9% for USMDs, a 2.7 pp difference. The genuine structural gap shows up in which programs DOs match into, not whether they match. And at Step 2 CK 260+, the per-program invite gap with MDs closes entirely.
TL;DR
- Match rate is nearly tied. DO 95.2% vs USMD 97.9% (NRMP 2024, conditional on ranking IM).
- Program-tier sort is dramatic. Bottom-quartile IM programs invite 46% DOs, 41% USMDs. Top-quartile programs invite 24% DOs, 65% USMDs.
- Step 2 closes the gap. Per-program invite probability gap shrinks from -2.1 pp at <240 to +0.4 pp (DO ahead) at 260-269.
- The Step 2 floor is harsher for DOs. Unmatched DOs averaged Step 2 220 vs unmatched USMDs at 234. DOs who underperform on Step 2 have less margin.
- Signal lift is symmetric across types. MDs <240 get 1.89x, DOs <240 get 1.78x. The signaling system does not penalize DOs in IM.
Finding 1: The match-rate part is basically a tie
The starting point is the NRMP 2024 Charting Outcomes data, restricted to applicants who ranked IM as their preferred specialty. The match rates by applicant type are:
| Type | n applicants | Matched | Unmatched | Match rate | 95% CI |
|---|---|---|---|---|---|
| US MD | 3,088 | 3,024 | 64 | 97.9% | [97.4%, 98.4%] |
| DO | 1,393 | 1,326 | 67 | 95.2% | [93.9%, 96.2%] |
A 2.7 pp gap. If match rate were the only metric, you would conclude DOs are essentially equivalent in IM. The numbers support that conclusion. But match rate hides one critical layer: which programs each cohort ends up at.
Finding 2: Program-tier sorting is dramatic
We split all 593 IM programs into Step 2 quartiles by the program-level midpoint of invited applicants' Step 2 CK scores. (Midpoint is defined as the average of the 10th and 90th percentile of each program's invited applicants, since most programs do not report median.) Top-quartile programs have a midpoint of 250-262. Bottom quartile is 230-242.
Within each quartile, we computed the share of each program's invites going to each applicant type:
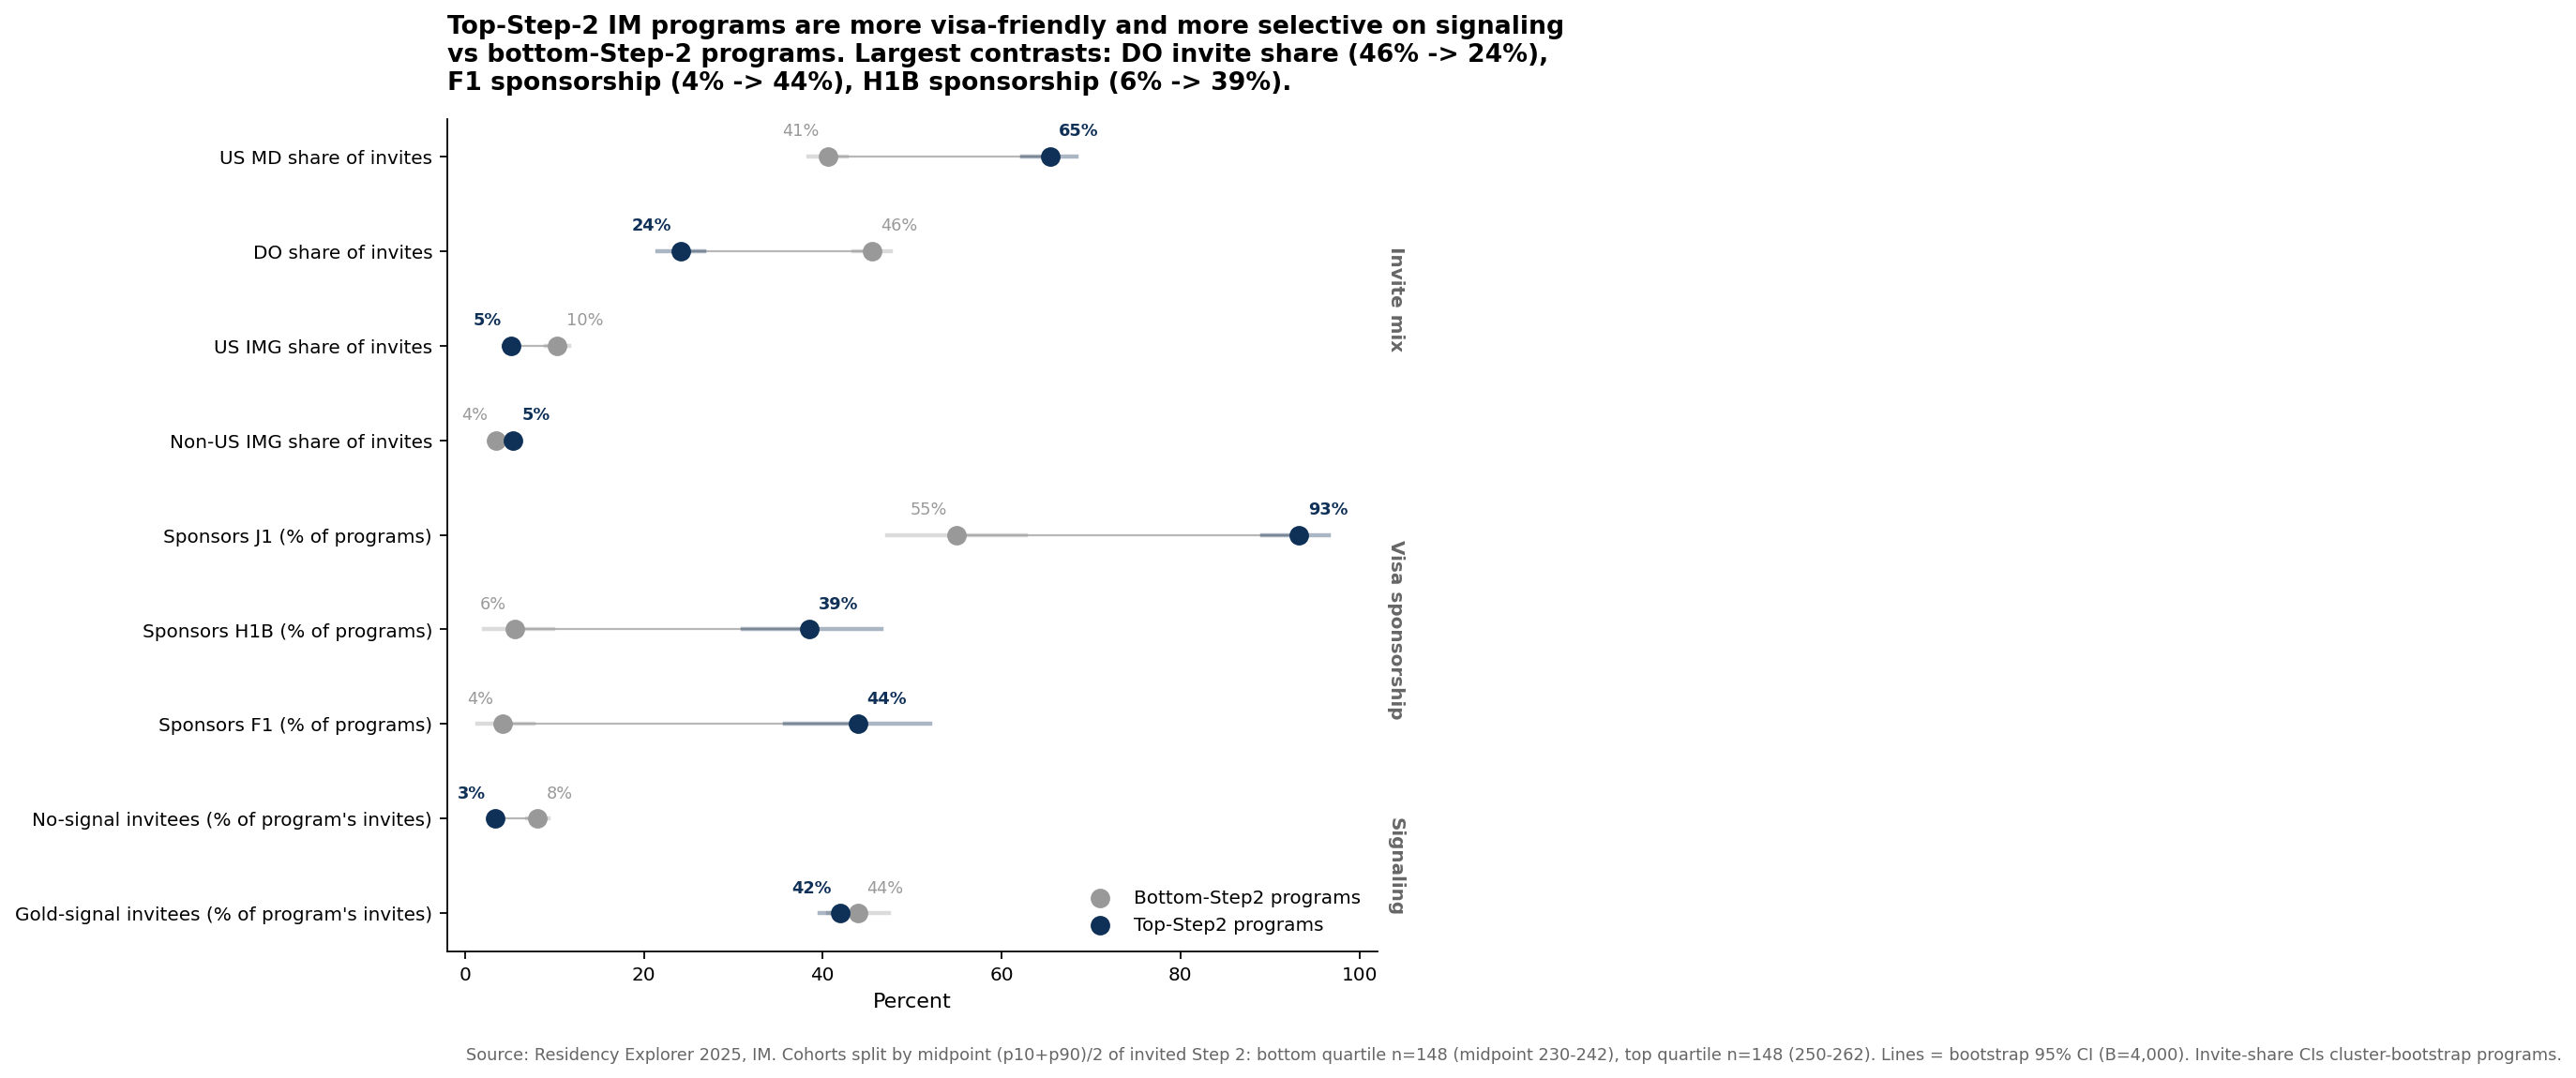
| Metric | Bottom quartile (Step 2 230-242) | Top quartile (250-262) | Delta |
|---|---|---|---|
| USMD invite share | 40.6% | 65.4% | +24.8 pp |
| DO invite share | 45.5% | 24.1% | -21.4 pp |
| US IMG invite share | 10.3% | 5.1% | -5.2 pp |
| Non-US IMG invite share | 3.5% | 5.4% | +1.8 pp |
In bottom-tier IM programs, DOs are the single largest invite cohort. In top-tier programs, USMDs are nearly two-thirds of invites and DOs drop to a quarter. The 2.7 pp aggregate match-rate gap masks a much more dramatic program-tier divergence. “Matched IM as a DO” and “matched IM as a USMD” tend to mean different programs.
Caveat: the data does not distinguish program preference (the program filters DOs out) from applicant self-selection (DOs do not apply to the top quartile at the same rate). Both forces likely contribute. The aggregate sort is real regardless of mechanism.
Finding 3: At Step 2 260+, the per-program gap closes
We computed P(invite) per applicant-program pair, by applicant type and Step 2 band, using the signal-lift cohort from our applicant-level data (n=628 programs with eligible coverage).
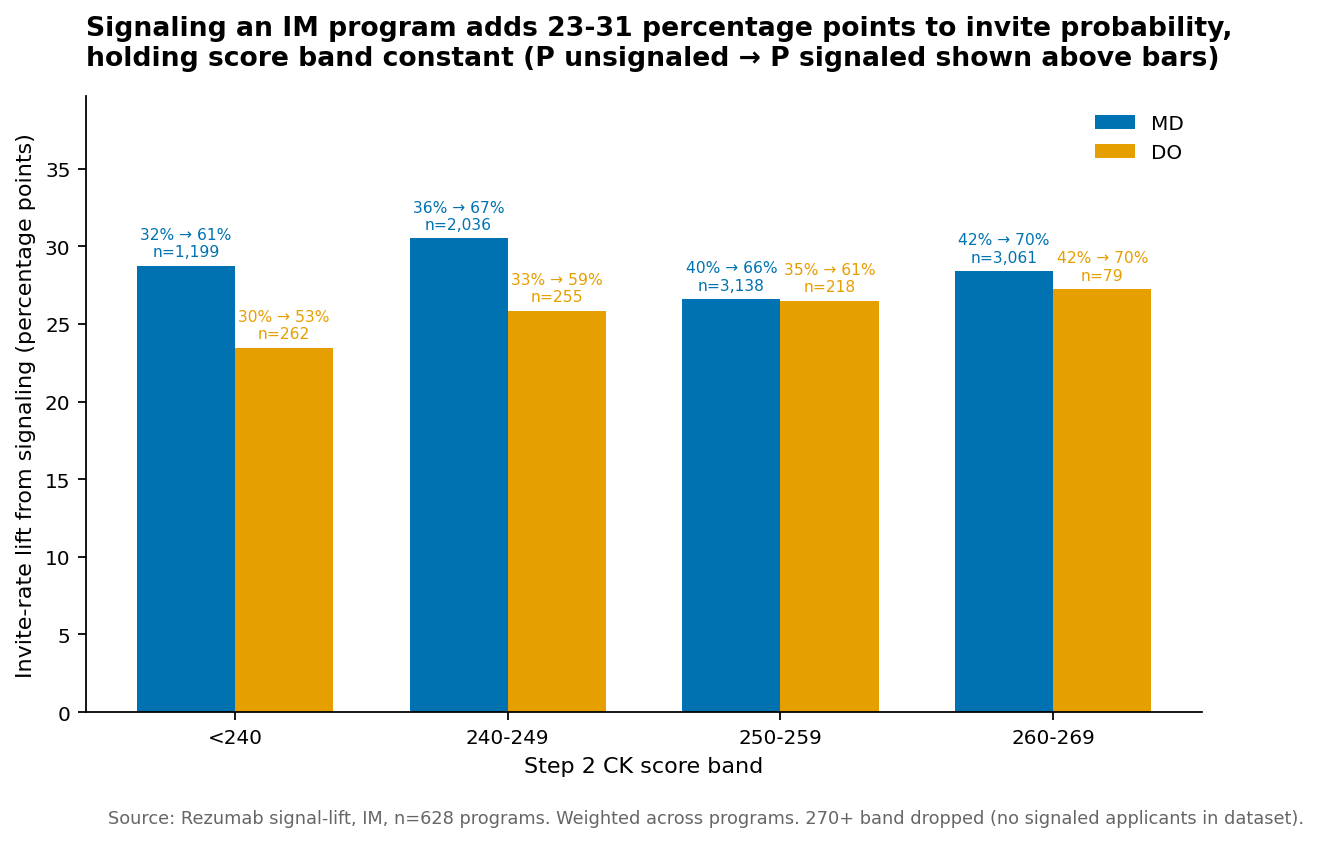
| Step 2 band | MD P(invite, unsignaled) | DO P(invite, unsignaled) | DO − MD gap | MD signaled lift | DO signaled lift |
|---|---|---|---|---|---|
| <240 | 32.1% | 30.0% | -2.1 pp | 1.89x | 1.78x |
| 240-249 | 36.3% | 33.0% | -3.3 pp | 1.84x | 1.78x |
| 250-259 | 39.9% | 35.0% | -4.9 pp | 1.67x | 1.76x |
| 260-269 | 42.0% | 42.4% | +0.4 pp (DO ahead) | 1.68x | 1.64x |
Three observations:
- The gap is monotonic until 260+. Each Step 2 band, the DO baseline trails the MD baseline by a few percentage points. The gradient flattens as scores rise.
- At 260-269, the gap inverts. DOs in the 260-269 band have a marginally higher per-program invite probability than MDs in the same band. The penalty has vanished. (Note: sample size in this band is smaller for DOs, n=79 signaled, n=1,225 unsignaled.)
- Signal lift ratios are similar across types. The signaling system multiplies invite probability by roughly the same factor for MDs and DOs. Signaling is not a USMD-only mechanic.
Caveat: the <240 and 260+ bands in the DO column have small absolute counts. Treat the direction as robust; treat magnitude point-estimates as wide-CI.
Finding 4: The Step 2 floor is harsher for DOs
A different way to look at the same data: among IM applicants who failed to match, what did their Step 2 look like? This is selection on the outcome, but the floor tells you how forgiving the system is to a weak score in each type.
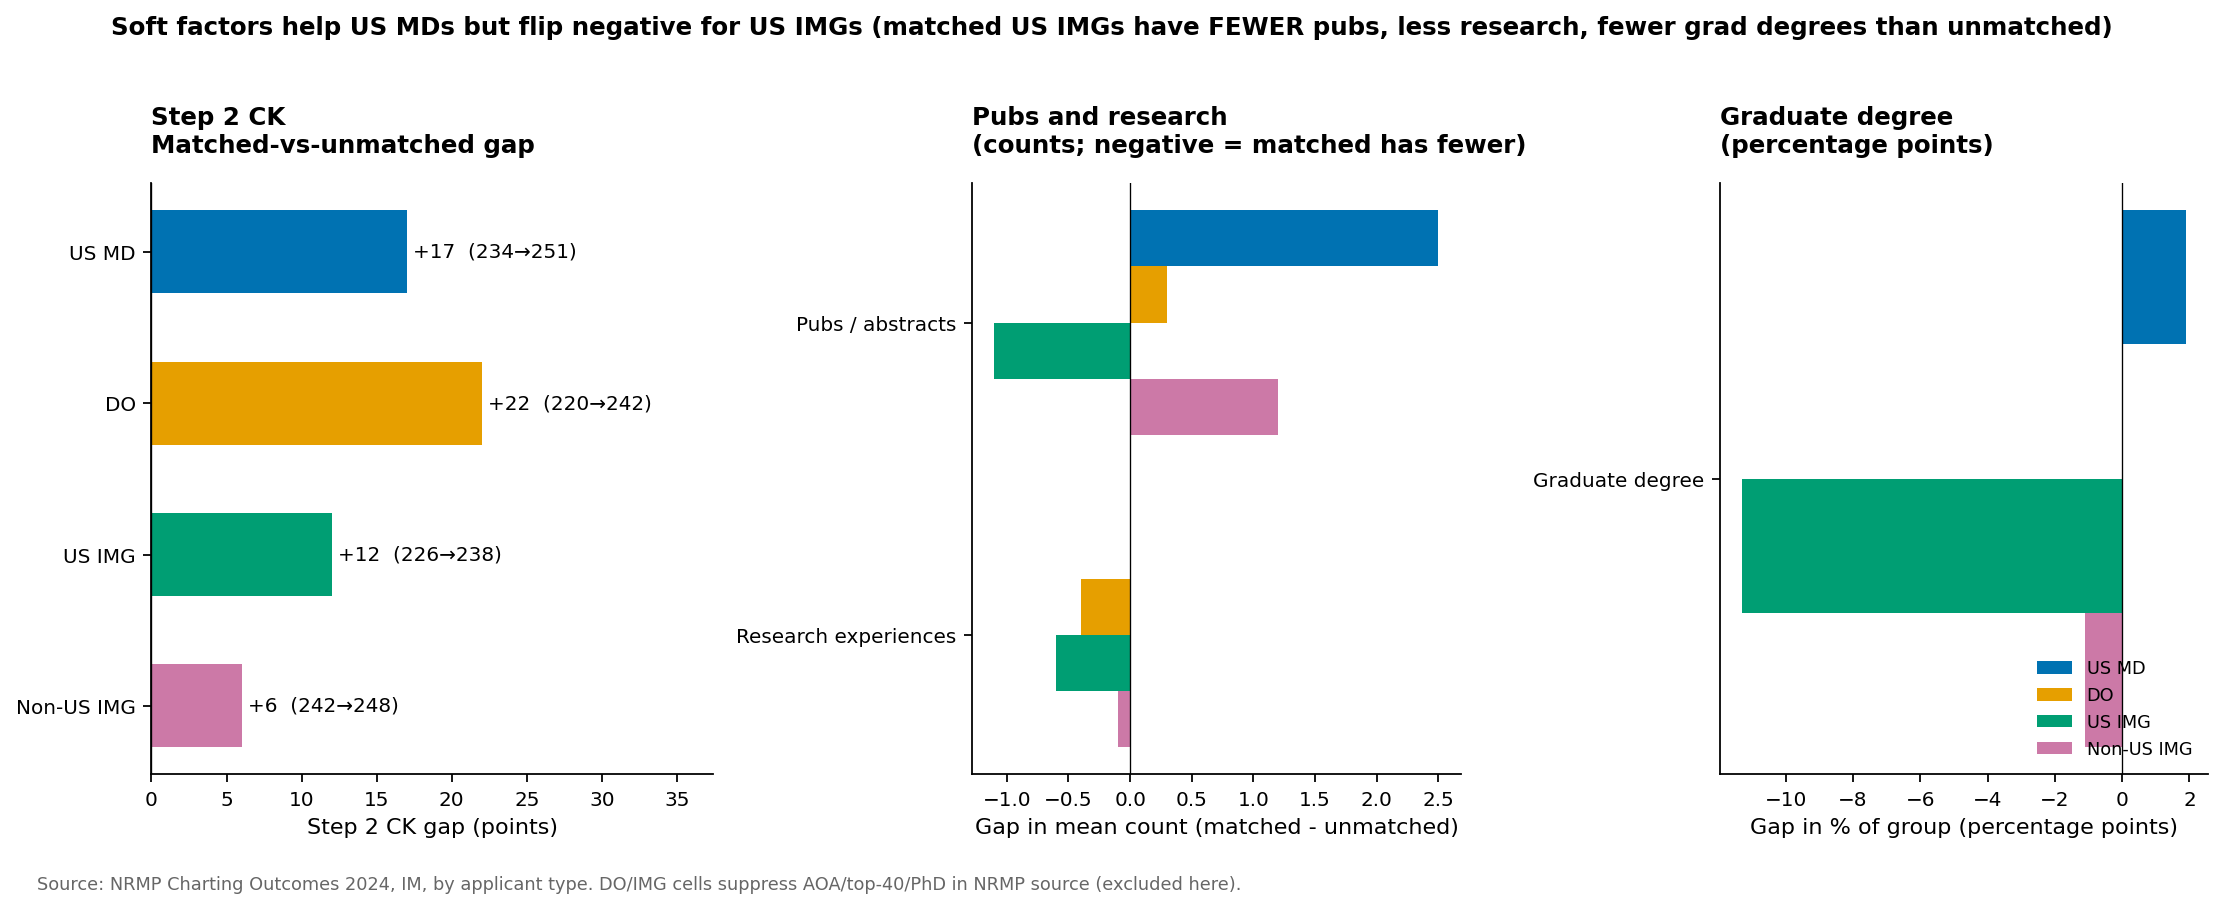
| Type | Step 2 matched | Step 2 unmatched | Within-type gap |
|---|---|---|---|
| US MD | 251 | 234 | +17 |
| DO | 242 | 220 | +22 |
Two reads:
- Matched DOs averaged Step 2 = 242. Matched USMDs averaged 251. The DO matched applicant is on average 9 points behind the MD matched applicant, but still cleared the bar.
- Unmatched DOs averaged Step 2 = 220. That is 14 points below the USMD unmatched average (234). DOs who failed to match did so with much weaker Step 2 scores than USMDs who failed. The implication: a weak Step 2 has higher cost for DOs than for MDs.
Combined with Finding 3, this is the actionable narrative: Step 2 is the single largest lever for a DO applicant in IM. A DO at 260+ has per-program invite probability indistinguishable from an MD at 260+. A DO at <240 still matches at high overall rates but is sorted toward bottom-quartile programs.
Caveat: n=64 unmatched USMDs and n=67 unmatched DOs in NRMP 2024 IM. Step 2 means are stable; specific factor percentages (AOA, top-40 school) are wide-CI at this n. Several DO/IMG metrics (AOA, top-40 NIH school, PhD) are suppressed to zero in the NRMP source for non-USMD types.
Finding 5: Applicant pool composition gives the structural context
The four applicant types do not arrive in equal numbers. The IM applicant pool is dominated by Non-US IMGs and US MDs, with DOs and US IMGs filling out the middle.
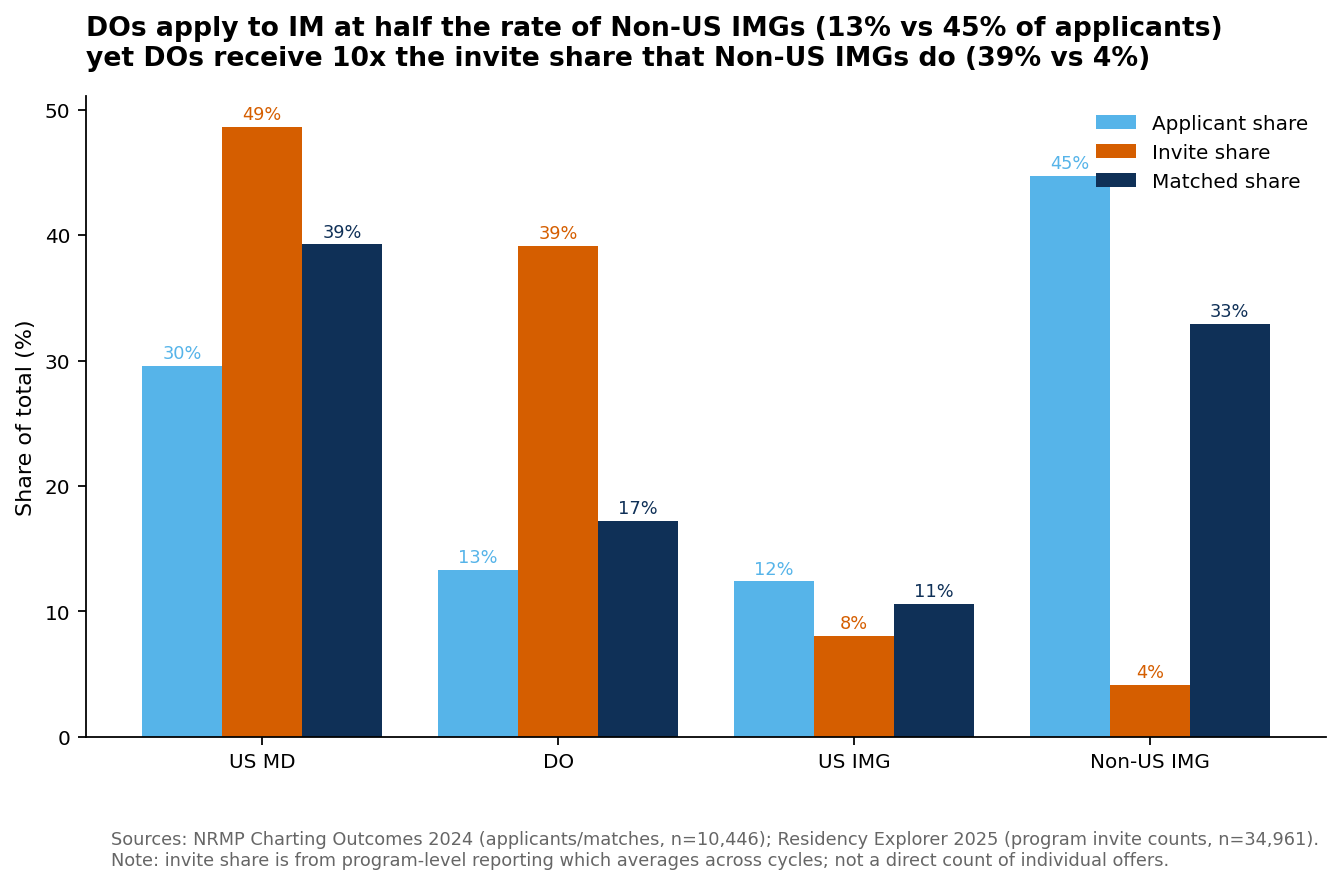
The relevant cross-type comparison: DOs over-perform their applicant share at the invite stage (13% of applicants → 39% of invites, roughly 3x), while USMDs over-perform less dramatically (30% → 49%, roughly 1.6x). Both groups are over-invited relative to their pool size. Non-US IMGs absorb most of the structural penalty.
For DO applicants specifically, this should reframe the conventional wisdom: in IM, you are competing for over-allocated invite share, not under-allocated. The constraint is which programs invite you, not whether any program does.
What this means for DO IM applicants
- Step 2 is the biggest lever you have. A 260+ Step 2 closes the per-program invite gap with MDs entirely. A <240 Step 2 sorts you toward bottom-quartile programs even if you ultimately match.
- Bottom-quartile programs are not a bad outcome. They train hospitalists, primary-care physicians, and subspecialty fellows. But if your target is a top-tier academic program with strong fellowship placement, the data says you need to clear the 250+ Step 2 bar to be invite-competitive.
- Signaling works for you. Lift ratios are statistically indistinguishable from USMD lifts. Use your signals on programs you can plausibly invite at, not on top-quartile programs where signal lift will fight headwinds.
- Programs with DO history are real. Bottom-quartile programs invite 46% DOs. The signal that those programs invite many DOs is data. Filter for those programs explicitly when building a list.
- The match-rate ceiling is high. 95.2% is not a number to panic about. The strategic question is not “will I match” but “where will I match.”
What this means for USMD IM applicants
- The 97.9% match rate is conditional. Selection on ranking IM. Your individual probability depends on your scores, school, and research, not the aggregate.
- Step 2 still matters within-type. USMD matched at 251, unmatched at 234, a 17-point gap. The 0% AOA among unmatched USMDs is mathematically a sample observation, but every unmatched USMD in the NRMP 2024 IM sample was non-AOA. Pedigree signal exists.
- Top-quartile programs are not USMD-only. Top-quartile programs invite 24% DOs and 5.4% Non-US IMGs. Less than the bottom quartile, but the door is not closed for DOs and IMGs at the top.
- Soft factors are weighted, but Step 2 is still the load-bearing axis. Pubs +2.5 for matched vs unmatched USMDs is real, but small relative to the Step 2 +17 gap.
Run your own numbers
Rezumab's match probability engine uses NRMP 2024 Charting Outcomes and applicant-level data, type-aware (separate models for USMD, DO, US IMG, Non-US IMG). The per-program search lets you filter by Step 2 range, DO invite share, and signal lift.
Related reading
Methodology & Sources
Match rates and applicant-pool composition come from NRMP Charting Outcomes 2024 (US MD Seniors, US DO Seniors, and IMG reports), restricted to applicants who ranked Internal Medicine as their preferred specialty. Match rate is therefore conditional on the outcome (people who did not rank IM are excluded). Program-level invite share, visa sponsorship, and Step 2 midpoint statistics are computed from program-reported applicant invite data, n=593 IM programs with eligible coverage.
Signal lift comes from applicant-level data, n=628 IM programs with eligible coverage, comparing P(invite) for signaled vs unsignaled applicants stratified by applicant type and Step 2 band. Ratios are probability ratios, not odds ratios. The 270+ Step 2 band is omitted because there are no signaled applicants in that band in the data.
Caveats: per-program invite counts are program-reported averages across cycles, not unique-applicant offer counts. NRMP suppresses several DO and IMG cells (AOA, top-40 NIH school, graduate degree) by reporting them as zero; do not interpret those as true zero effects. Unmatched USMD n=64 and unmatched DO n=67 in NRMP 2024 IM, so within-type unmatched factor estimates are wide-CI.
Reproducible analysis lives at data-don-reports/im-2026-05-14/ in the Rezumab repo.